2023 Survey Results
The Results Are In!
Watch the DEI Campus Climate Survey Data Release Webinar to contextualize the results. Take the time to:
- Explore high-level key findings.
- Learn why perceptions of diversity, equity, and inclusion at Rutgers matter.
- Revisit the Equity Audit and reflect on how far we have come.
Measuring Inclusive Climate Survey
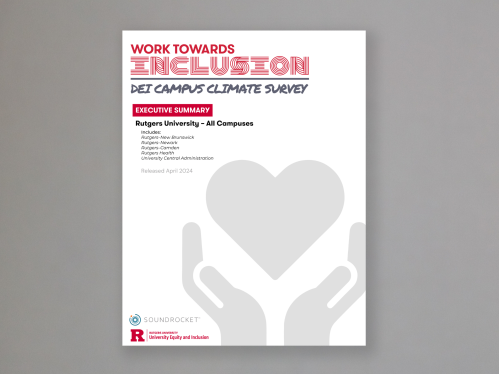
The 2023 survey was called the DEI Campus Climate Survey and the reports still show that name. We have updated the name of the survey to clarify its purpose, which is to measure inclusive campus climate.
Rutgers University – All Campuses
The Rutgers University – All Campuses report aggregates data across Rutgers–New Brunswick, Rutgers–Newark, Rutgers–Camden, Rutgers Health, and the University Central Administration, providing a picture of Rutgers University overall.
Of the 76,929 eligible participants across Rutgers University, 12,725 responses were collected, yielding an overall response rate of 16.5%, with a significantly higher response among faculty and staff.

Why take the DEI Campus Climate Survey?
Access the Primary Unit Reports
Rutgers–New Brunswick
Of the 43,956 eligible participants in New Brunswick, 6,128 responses were collected, yielding an overall response rate of 13.9%, with a significantly higher response among faculty and staff.
Note: Staff, for example, facilities and public safety, that report to Institutional Planning & Operations, a central administrative unit, are captured in University Central Administration, not their respective Chancellor-led unit.
Rutgers–Newark
Of the 9,878 eligible participants in Newark, 1,323 responses were collected, yielding an overall response rate of 13.4%, with a significantly higher response among faculty and staff.
Note: Staff, for example, facilities and public safety, that report to Institutional Planning & Operations, a central administrative unit, are captured in University Central Administration, not their respective Chancellor-led unit.
Rutgers–Camden
Of the 5,689 eligible participants in Camden, 865 responses were collected, yielding an overall response rate of 15.2%, with a significantly higher response among faculty and staff.
Note: Staff, for example, facilities and public safety, that report to Institutional Planning & Operations, a central administrative unit, are captured in University Central Administration, not their respective Chancellor-led unit.
Rutgers Health
Of the 13,198 eligible participants in Rutgers Health, 2,958 responses were collected, yielding an overall response rate of 22.4%, with a significantly higher response among faculty and staff.
Note: Staff, for example, facilities and public safety, that report to Institutional Planning & Operations, a central administrative unit, are captured in University Central Administration, not their respective Chancellor-led unit.
University Central Administration
Of the 4,208 eligible participants in the Central Administration, 1,451 responses were collected, yielding an overall response rate of 34.5%.
Note: Staff, for example, facilities and public safety, that report to Institutional Planning & Operations, a central administrative unit, are captured in the University Central Administration primary report, not their respective Chancellor-led unit.
Unit Climate Reports Available Now
In addition to asking questions about a Chancellor-led unit or the University Central Administration, survey respondents were asked to reflect specifically on their primary college/unit. Employees (faculty and staff) were asked to answer a subset of questions reflecting on conditions in their immediate work environment. Students were asked to answer questions reflecting on their primary college/department.